Equatorial Plasma Bubble (EPB) Alert Instruction Manual
EPB Alert
This is the manual on how to use the Equatorial Plasma Bubble (EPB) Alert webpage. Equatorial Plasma Bubble is the region of depleted plasma in the ionosphere that develops at low and equatorial latitudes. EPBs can impact radio waves, satellite communications, and navigation systems. The EPB Alert webpage shows the information of (1) EPB Realtime, (2) EPB Forecast, (3) Ionogram/VHF data, (4) Positioning Error and (5) ROTI index over the Southeast Asia sector based on the SEALION (Southeast Asia Low-Latitude Ionospheric Network) data.
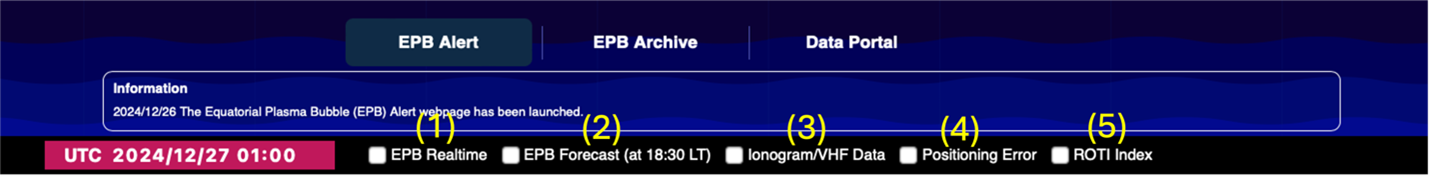
Figure 1. EPB Alert webpage.
How to Display the EPB Realtime
Click on (1) the EPB Realtime checkbox (ON by default) to display the information of the realtime EPB alert. The alert is displayed over 5 SEALION stations (Bac Lieu, Cebu, Chiang Mai, Chumphon and Kototabang). If there is an EPB event, a flashing red circle alert (a), EPB cresent-shaped icon (b) and text bubble showing the details information (c) will be displayed over the station that observes the event as shown in Figure 2.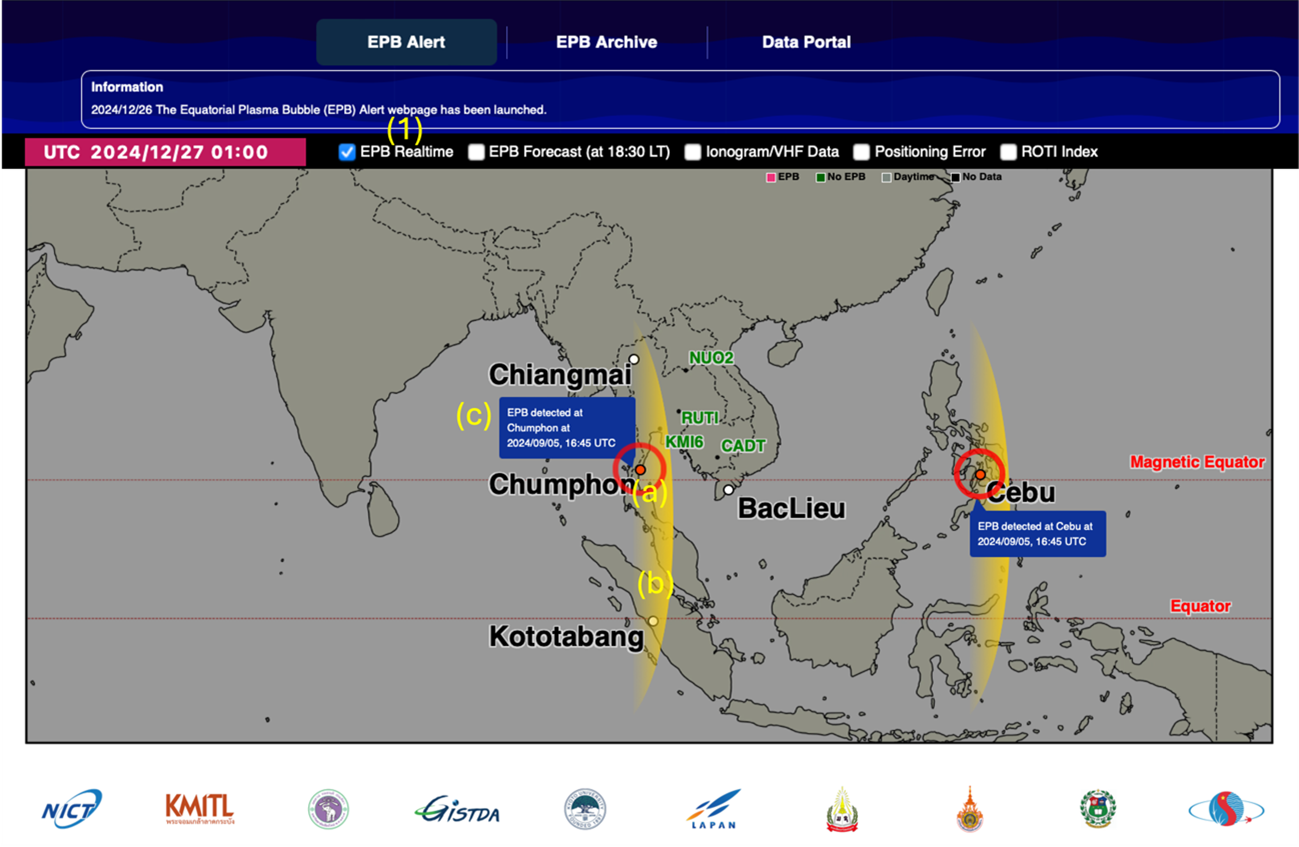
Figure 2. EPB Realtime Alert showing events over Chumphon and Cebu.
If there is no EPB event, a banner (d) will be displayed as seen in Figure 3.
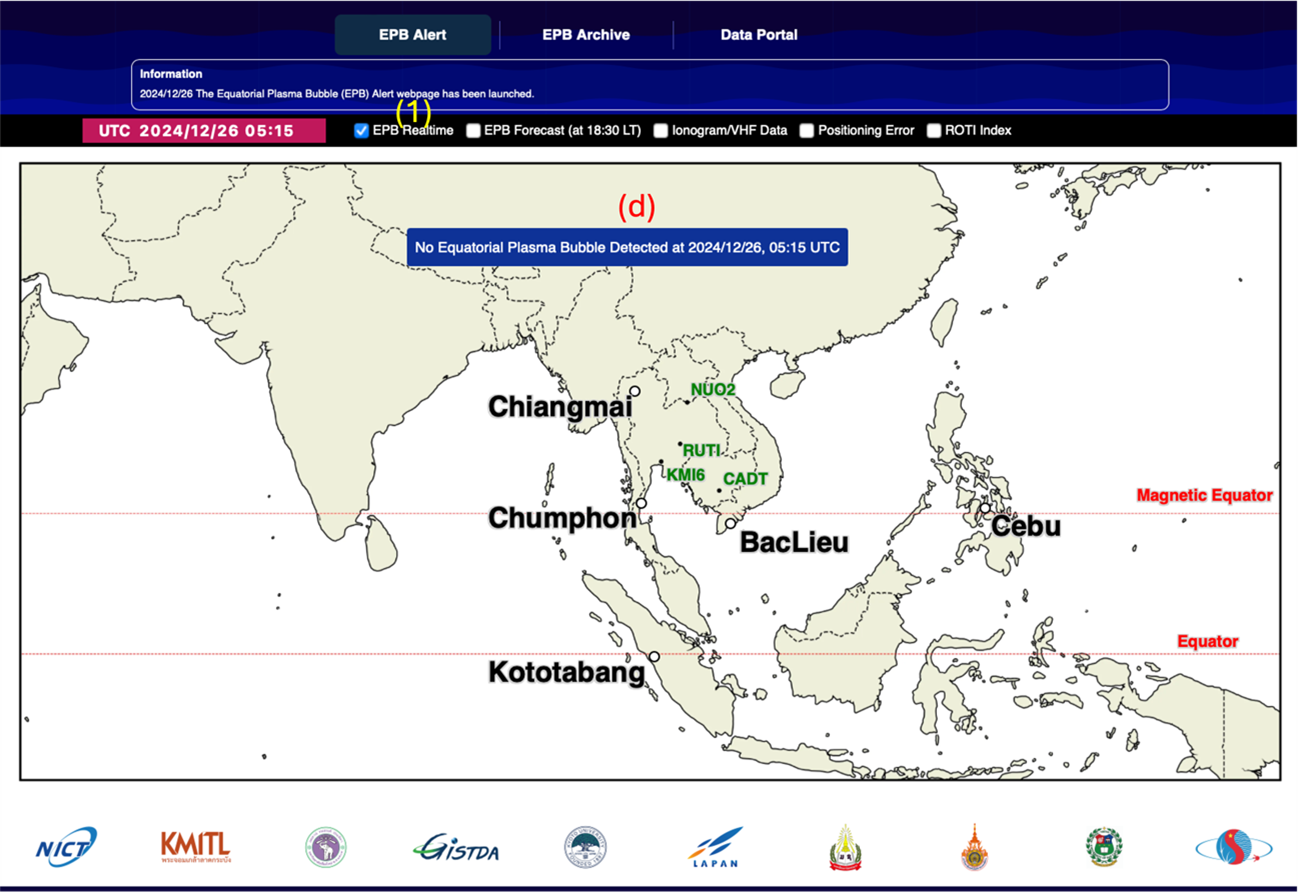
Figure 3. No EPB event observed across SEALION station.
How to Display EPB Forecast
Click on (2) the EPB Forecast check box to display the information of the post-sunset EPB event possibility in the next two hours from each station. The forecast bar showing the forecast of each station will be displayed (e). Click on the forecast icon to display the text (f). This forecast is displayed once a day at 18:30 LT and is displayed in 4 levels as shows in the table below. This forecast is based on the Redmon et al., 2010 method.| Alert level | Percentage |
|---|---|
| 4 | > 80% |
| 3 | 50-80% |
| 2 | 30-50% |
| 1 | < 30% |
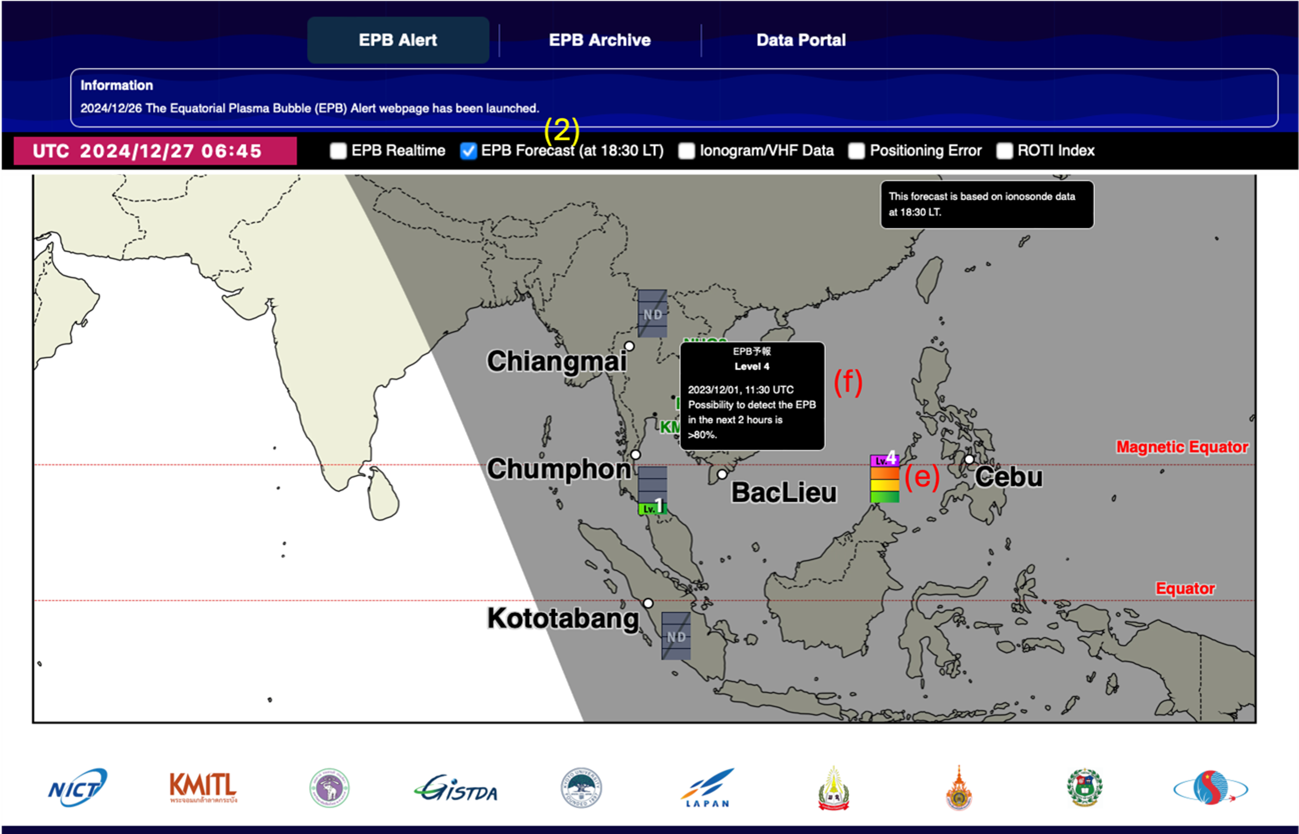
Figure 4. EPB forecast showing probability of post-sunset EPB event from the next two hours from each station.
How to display the Ionogram/VHF Data
Click on (3) the Ionogram/VHF data check box. Ionogram image (g) from 5 stations (Bac Lieu, Cebu, Chumphon, Chiang Mai and Kototabang) and VHF radar from Chumphon (h) will be displayed with 15 mins interval. Click the image to enlarge it.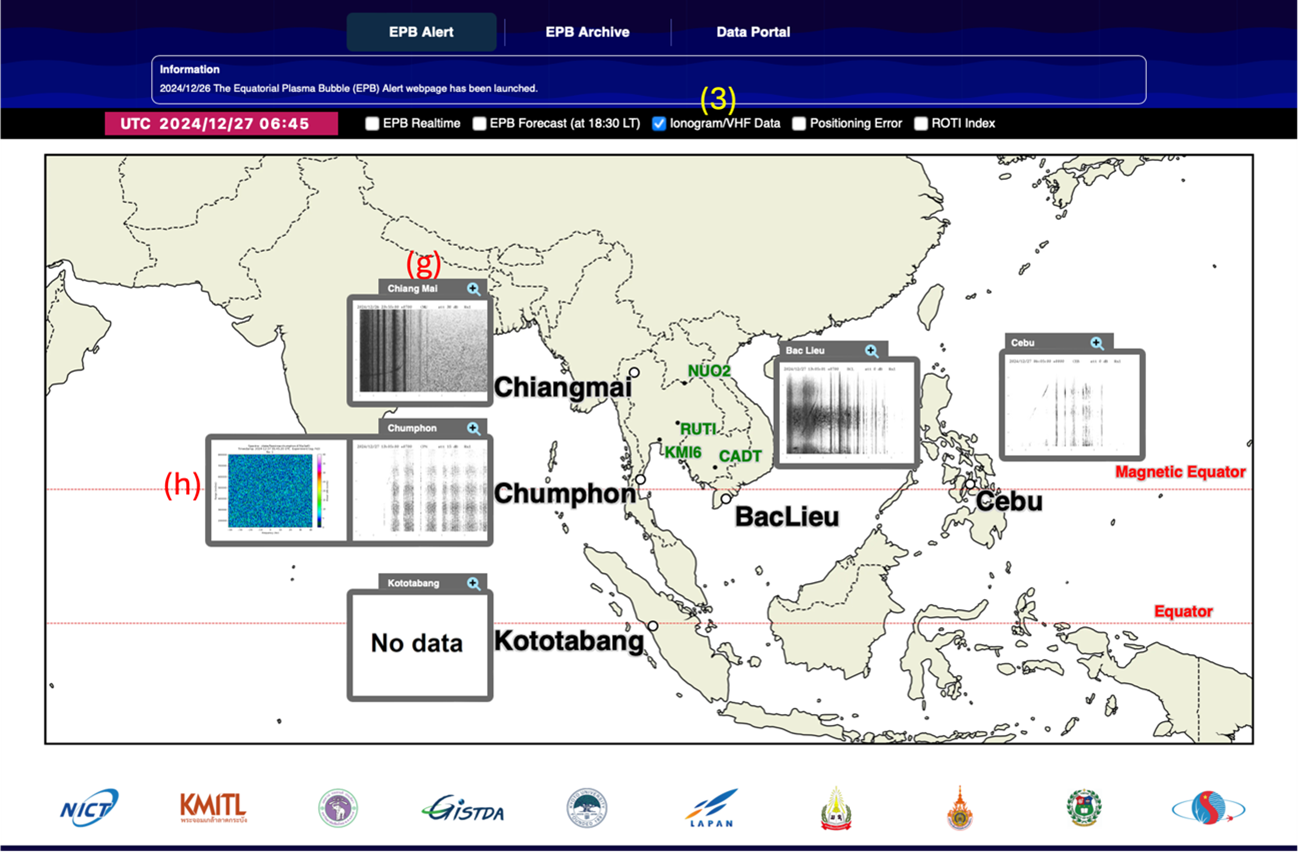
Figure 5. Ionogram and VHF radar data with 15-minute interval.
How to Display the Positioning Error
Click on (4) the Positioning Error checkbox, A blue and green circle (i) will be displayed which corresponds to the size of the positioning error in cm as shown in legend (j) for each available location. The blue and green circles indicate the vertical and horizontal errors, respectively.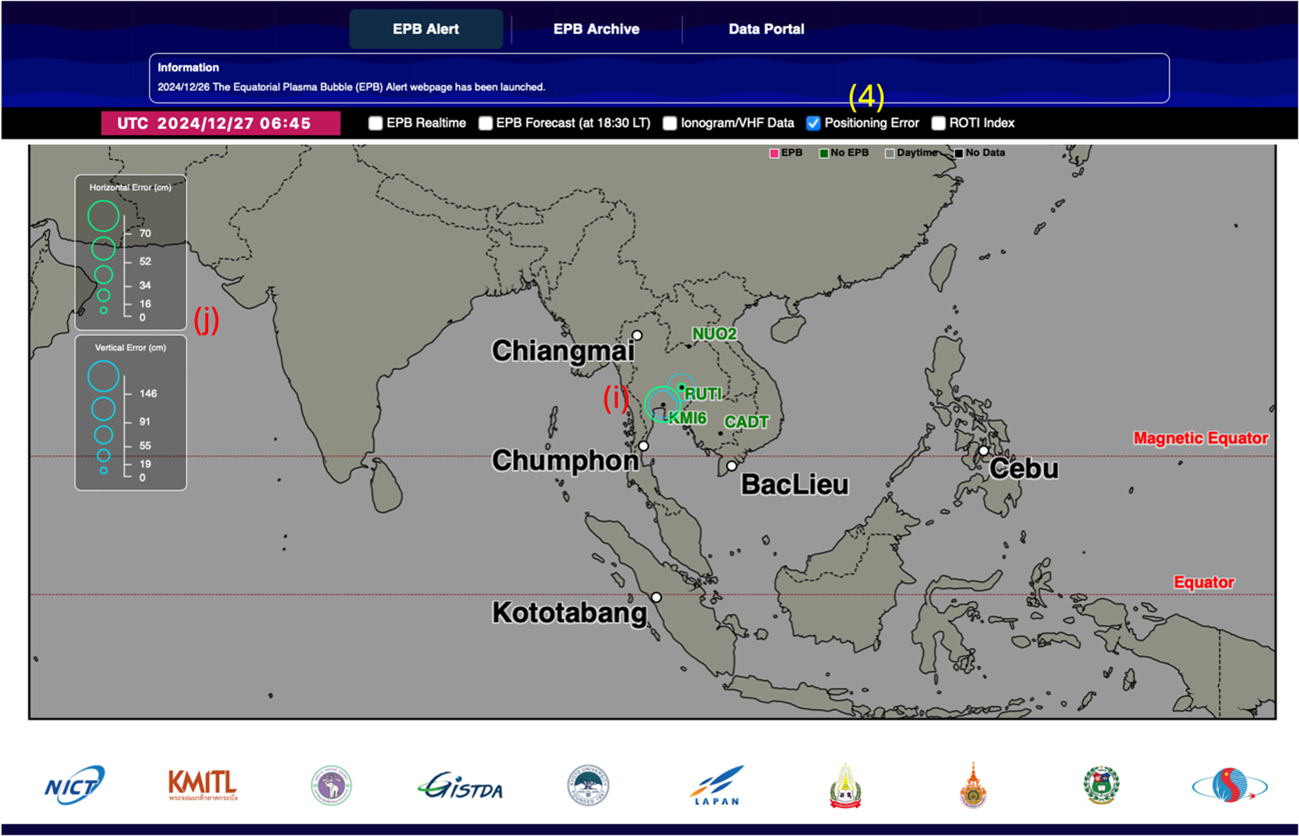
Figure 6. Blue and green circle showing the value of vertical and horizontal error, respectively.
How to Display the ROTI index
Click on (5) the ROTI index checkbox, dark yellow (k) circle will appear in the station that have the ROTI index data. The legend (l)shows the different circle sizes correspond with the value of the ROTI index ranging from 0-1.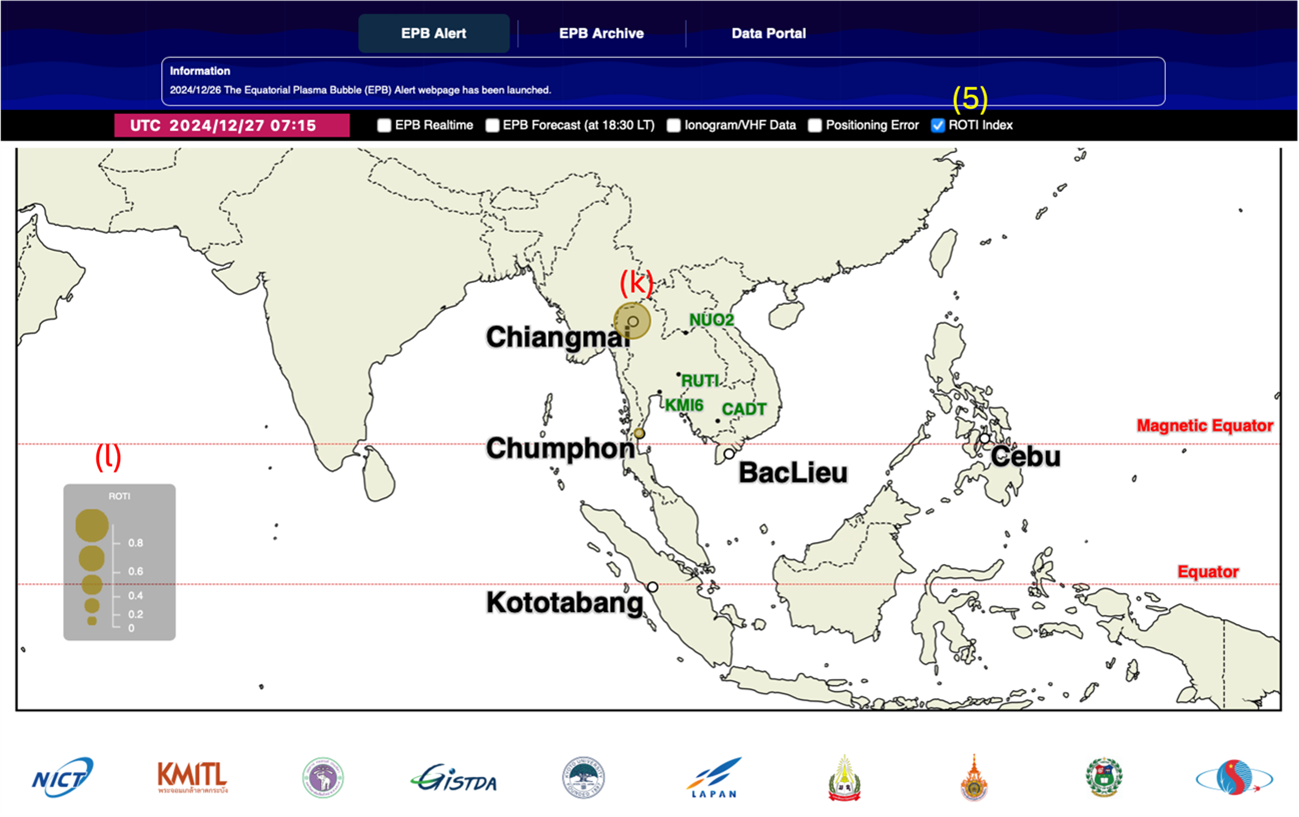
Reference
Redmon, R. J., D. Anderson, R. Caton, and T. Bullett (2010), A Forecasting Ionospheric Real‐time Scintillation Tool (FIRST), Space Weather, 8, S12003, doi:10.1029/2010SW000582.